Cohort Analysis

What is cohort analysis?
Cohort analysis is a method for evaluating user interactions with your product by grouping users into distinct cohorts based on shared characteristics and then tracking their behavior over time. By examining these groups, you can uncover how user behavior evolves over time, allowing you to identify problem areas and opportunities across the user journey and conversion funnel.
A cohort is simply a group of users who share a common trait, often tied to the time when they completed an action. For example, you might group users based on the month they first signed up for your product.
This is similar to how you’d divide school classes based on the year they started. One cohort for the Class of 1996, another for the Class of 1997.
This time-based grouping enables you to analyze behavioral patterns and trends that develop over specific periods, offering valuable insights into the effectiveness of your onboarding, feature releases, or other major product changes.
Cohort analysis is like a time-lapse of your product data, revealing how user groups behave and adapt across their lifecycle. For instance, you might discover that users who signed up in January have lower retention rates than those who signed up in February. With this insight, you can investigate what might have impacted these behaviors (perhaps a feature change or a tweak to your onboarding process) and take corrective action.
It’s important to distinguish cohort analysis from segmentation, as the two are often confused. Segmentation groups users based on shared characteristics, such as their role or geographic location, but it typically provides a static snapshot of user behavior. For example, segment analysis might help you understand how certain stakeholders are using your product at a given moment in time. While useful for personalization or targeting, it doesn’t provide insights into how behaviors change over time.
Cohort analysis, on the other hand, adds a time dimension to segmentation. By slicing segments into time-based cohorts, you can observe how specific user groups respond to changes or progress through the customer journey. For instance, analyzing acquisition cohorts – who are users grouped by their signup date – can highlight shifts in user retention following a major product update or a new onboarding flow.
This dynamic view of your user base is invaluable for uncovering actionable insights. It allows you to understand how behaviors evolve, pinpoint challenges, and identify what’s driving success or failure in specific groups. In short, cohort analysis is a powerful tool for tracking user behavior over time, helping you make data-driven decisions to improve your product and keep users engaged.
A quick word on customer cohort analysis
When going about your day as a Product Manager, you may often see cohort analysis described as customer cohort analysis. If you’re going to be a stickler for the rules, you need to be aware that this isn’t correct. These two terms shouldn’t be used interchangeably, as there are subtle differences between the two.
Cohort analysis is a general approach to grouping your users into a time-based cohort. Here, EVERYONE who uses your product is eligible to be grouped into different cohorts. This means people who are on a trial, reverse trial, freemium users, and long-term customers. If they’ve adopted your product, they’re included in cohort analysis.
Customer cohort analysis is essentially a filter, where you have a more specified look at just the users who have become customers. This means people who are generating revenue for you and users who have been activated. In everyday talk – these are actual paying customers.
Customer cohort analysis helps Product Teams learn how revenue-driving customers are using their product over their lifetime, and from those learnings, they can work out what to do to make the product better.
It’s important to know the difference here, as the actions and behaviors of customers are going to be very different from all your other users. You’re going to be learning different things depending on what form of cohort analysis you’re doing. It’s like one is monitoring the behaviors of all the bugs in your backyard, while the other is just looking at butterflies.
Got the difference? Sweet, let’s crack on.
Why use cohort analysis?
As a Product Manager, few things sting more than customer churn. It’s never nice to watch the users you’ve worked so hard to acquire and nurture start to drop off. Cohort analysis is one method that gives you the chance to learn why this is happening and how you might fix it. It’s your detective toolkit for getting answers.
By grouping users based on shared traits or behaviors – like when they signed up or how they interacted with a feature – you can pinpoint where engagement drops off. Is the onboarding process letting you down? Is a specific feature failing to deliver on the value proposition? Cohort analysis reveals the weak links in your product experience.
But cohort analysis does more than simply spot problems, it can also show you opportunities. By dividing users by their actions and measuring retention over time, you’ll be able to see the stickiest areas of your product and the specific actions users are taking that are leading to long-term loyalty.
Cohort analysis is particularly useful when you launch a new feature, make changes to a user flow, alter the UI – or any other significant changes that you want to understand the impact of. For example, you can compare pre-change cohorts who signed up without the new experience to post-change cohorts and analyze differences in behavior. This comparison can provide valuable feedback on the success of your updates and guide further improvements.
With this data in hand, you’ll be able to make targeted improvements to get more users to perform this certain action, improving the performance of your product.
If the thought of customer churn is keeping you up at night, cohort analysis can be that nightlight that helps you dream sweetly.
Benefits of cohort analysis
To fully understand why you should give cohort analysis a go, let’s explore some of the key benefits of this analysis framework. Cohort analysis lets you dig deep, giving you the insight to make smart, data-driven Product Management decisions. Here’s why it can be a game-changer:
- Identify what drives (or hinders) retention: By tracking when and why users drop off, you can pinpoint areas for improvement. Whether it’s an onboarding glitch or an underwhelming feature, this method will let you know where to focus your efforts.
- Understand user behavior over time: Cohort analysis highlights patterns in user engagement, offering insights beyond vanity metrics. It helps you see how user interactions evolve and which behaviors signal loyalty – making them the behaviors you want to cultivate and encourage.
- Spot your most valuable customers: By comparing cohorts, you can identify which groups contribute the most revenue or stick around the longest. This insight helps you tailor marketing efforts and upselling opportunities.
- Fine-tune your product: Knowing which features boost retention means you can prioritize impactful changes. This helps you put resources into ideas that will make the biggest difference.
- Plan for growth with confidence: Cohort analysis gives clear, data-backed insights to guide strategic decisions. From retention strategies to feature rollouts, you’ll have the numbers to back up your moves.
- Tailor marketing efforts: By filtering cohorts by behavior or demographics, you can create more targeted campaigns that speak directly to your audience’s needs.
What are the different types of cohort analysis?
Cohort analysis comes in two main flavors – let’s give you a taste of both. The one that you choose all depends on what you’re trying to learn from your cohorts. Want to see how well you’re retaining users from a specific launch or campaign? One type has your back. Need to pinpoint which actions keep users coming back for more? The other type is your go-to. Let’s break them down:
Acquisition cohort analysis
This type of cohort analysis is all focused on seeing how users behave based on the dates that you first acquired them. By examining users who joined during the same period – whether it’s a specific week, month, or campaign – you can uncover trends in retention, engagement, and churn.
For example, say you have one marketing campaign that ran for a couple of weeks, and then rolled out a completely different one straight after. Acquisition cohort analysis can help you see if users from a certain marketing campaign stick around longer than others. It’s ideal for figuring out how differently users are engaging with your product based on when they first arrived.
The insights from acquisition cohorts allow you to fine-tune onboarding experiences, measure the impact of new feature launches on user retention, and even gauge how seasonal trends affect your user base.
Behavioral cohort analysis
Behavioral cohort analysis organizes users based on specific actions or behaviors they’ve taken during specific timeframes. This could include completing a tutorial, subscribing to a premium plan, or interacting with a particular feature.
It’s essentially a step up from acquisition cohort analysis. Here, you’re taking your previously made timebound cohorts, and then dividing them up again based on what they did during that period. Going back to our school analogy, it’s like taking the Class of 1996 and then creating cohorts based on what subjects they decided to study.
This type of analysis helps you figure out what actions lead to better retention rates, and uncover what features hold the most influence over long-term engagement.
By focusing on these user behaviors, you’ll be able to pinpoint the successful areas of your product and refine features or your onboarding process to better encourage new users to stay around. Like putting all the popular rides by the entrance of a theme park so that users engage with your best parts first.
How do you do cohort analysis?
Cohort analysis is a superb tool for understanding user behavior, but how on earth do you do it right? Here’s a step-by-step process to help you get to grips with the process.
Let’s go!
Step 1: Define your goals
Before jumping in, be clear about what you want to learn. This will dictate the type of cohort analysis you do. Are you looking to figure out what behavior indicates a churn risk, analyze feature stickiness, or understand what onboarding experience resulted in a better 90-day retention?
Knowing what you want to learn tells you where you need to look. A clear objective will guide what type of cohort you want to use.
Step 2: Create your cohorts
Once you have a grasp of what you want to find out, start making your cohorts.
The way you go about crafting a cohort is a bit different depending on the type you choose. Let’s break it down for you:
Acquisition cohort analysis
If you’re using acquisition cohorts, first decide on how you want to split the cohorts. Do you want to separate them by the initial signup date, the date they reached user activation, or something else? This step is important, as it will give you different insights.
Following that, you then need to work out by what timeframes you want to split up your cohorts. Will it be weekly, monthly, or quarterly? Will you split them up based on the duration of specific marketing campaigns? Again, the way you decide to slice things up will give you different results.
You also want to be clear with how long you want to measure these cohorts for. Are you looking to see how their metrics changed after a short period of time, or follow their progression for the long term?
Finally, work out what you actually want to measure with these newly defined cohorts. Is it retention rates you’re after, engagement rates, or other product adoption metrics?
Behavioral cohort analysis
For behavioral cohort analysis, you want to take the acquisition cohorts you’ve made and then identify the different actions you want to measure and the cohorts you want to create from that.
For example, you could take an interesting acquisition cohort – such as one that has lower retention metrics than the others – and then split these guys into fresh behavioral cohorts dividing them up by those who completed user onboarding, another for those who interacted with a certain feature, and one more for those who made a purchase.
Once you’ve pinpointed this, you can then group your users into these cohorts and start comparing thier behavior over time.
Step 3: Create your cohort chart
To properly analyze your cohorts, you need to create a cohort chart. This lets you plot the change in the chosen metric you want to track, making it easier to see any changes and differences between your cohorts.
To make your cohort chart, you plot your different cohorts into different rows and then track the change in your chosen metric in each column.
For example, if you’re plotting an acquisition cohort chart, looking at how retention rates changed over the course of two weeks for monthly cohorts who started a free trial, the process of creating your cohort chart will look something like this:
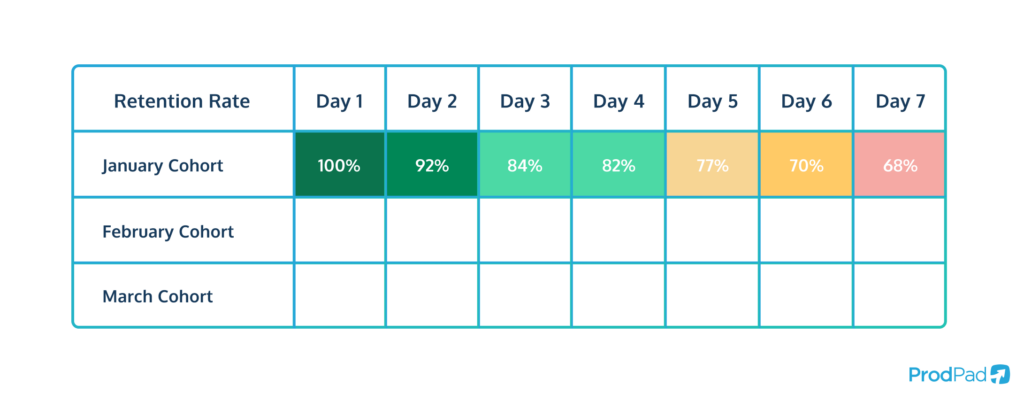
First, you’ll plot the change in retention rates for your first cohort, in this example the cohort from January. This data shows how the retention rate has fallen over a week, showing you how many of the entire cohort are still using your product by day 7.
From this, you then plot out the data for the other cohorts you want to look at, in this example, February and March:
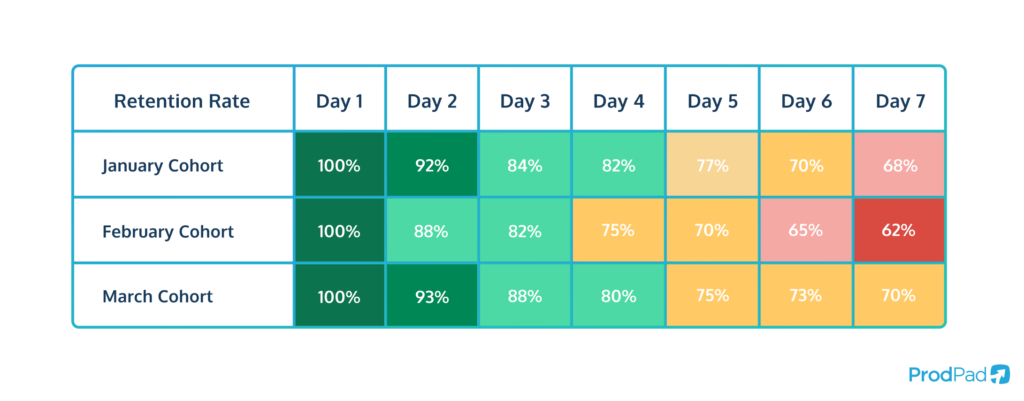
With this data, you’ll be able to see how different cohorts performed and compare how they behaved differently from each other.
In this example, you’ll be able to see that the February cohort saw a much larger drop in retention on day 4 compared to the other cohorts in this table.
This information can then help you figure out why. What did the February cohort do (or not do) on the fourth day that led to this behavior? To find out, you can then create a behavioral cohort analysis on this specific cohort to help you dive even deeper into the data.
Step 4: Analyze and form your hypothesis
As trends emerge from your cohort analysis, use them to formulate hypotheses about user behavior. For example, if you notice users tend to churn after a free trial, it might suggest they aren’t grasping the product’s value. Similarly, sharp declines in retention following the introduction of a particular feature could point to a usability issue or misaligned user expectations.
Look for patterns that identify which features contribute to user stickiness. If users who engage with a reporting tool tend to stay longer, consider it a retention driver worth promoting. These insights will form the foundation of hypotheses that guide your next steps.
Of course, these are only hypotheses – they’re not facts, even after this type of analysis. Instead, they’re just ideas, potential solutions that you’ll need to do product validation on and explore further to make sure they’re the right solution.
Step 5: Implement targeted changes
Once you’ve validated the insights gained from your cohort analysis, you can then make changes to tackle these issues and improve the performance of your product. Often, knowing the problem to solve points you in the right direction for the solution you need.
If early drop-offs are a problem, improving onboarding through a product tour can help guide users through your product’s most valuable features. For trial-period churn, you might focus on showcasing the wow moment earlier or by offering incentives to keep users engaged.
Similarly, double down on sticky features by making them more prominent within the product. Tutorials, in-app messages, or gamified rewards can encourage users to explore and adopt these high-retention features. These strategies will vary depending on what your cohort analysis reveals about user behavior.
Step 6: Monitor and iterate
Cohort analysis isn’t a one-and-done trick, and the changes you make from it aren’t going to solve all your problems forever. You need to treat cohort analysis as an iterative process, and continuously track how new, fresh cohorts behave after you’ve made your changes.
Compare this new data with your old ones to make sure that the changes you’ve made are having a positive impact on your product, and more importantly, your users.
Experimentation is key. Adjust onboarding flows, introduce new features, or test through A/B testing. Use these experiments to validate your hypotheses and fine-tune your strategies based on real user data. Over time, repeated analysis and iteration will help you refine your product experience and improve retention.
A group understanding
Cohort analysis is a powerful tool that helps Product Managers move beyond surface-level metrics to uncover actionable insights about user behavior. By analyzing cohorts – whether based on acquisition or behavior – you gain a clearer picture of how users engage with your product over time.
This can highlight everything from where users drop off to what features drive long-term loyalty. Armed with this knowledge, you can refine onboarding processes, prioritize impactful features, and create targeted strategies to boost retention and reduce churn.
But cohort analysis isn’t just about solving problems, it’s also about identifying opportunities. For example, it can help you pinpoint the actions and behaviors that create your most valuable users. With a better understanding of these dynamics, you can steer your product’s development toward delivering the experiences that matter most. Whether you’re running a SaaS business, a marketplace, or a consumer app, this type of analysis is indispensable for making data-informed decisions that drive product-led growth.
Understanding your customers is a key part of good Product Management. With ProdPad, you can really get to know them – and tie their pain points and goals into your roadmap and validation process. With ProdPad, you can build customer personas directly in the tool, and leverage AI-powered customer feedback analysis to get to the root of what your users need.
With best practices built-in, you’re empowered to be the best Product Manager you can be. See what else ProdPad can do with a free trial.
Try ProdPad for free